An equally important approach for the identification of vulnerable parts of the railway infrastructure as the analysis of past events is the identification of current and future natural hazards and their potential impact on infrastructure assets.
In order to keep the effort for hazard mapping reasonable, a multi level approach is highly recommended.
1st level: Screening - Identification of those parts of the network with a high exposure to natural hazards (priority areas)
2nd level: Investigation of priority areas by modelling efforts, development of maps of potential natural hazards
3rd level: Detailed investigation of priority areas by on site inspections and modelling approaches, development of high resolution natural hazard maps
1st level: Screening - Identification of priority areas:
This first phase of hazard mapping can be carried out by using the outcome of the analysis of past extreme weather events (see chapter A2) and their impact on the railway network especially on train delays and infrastructure damage. A second line of assessment it the use of the output of regional modelling of major hazards such as flooding (flood maps).
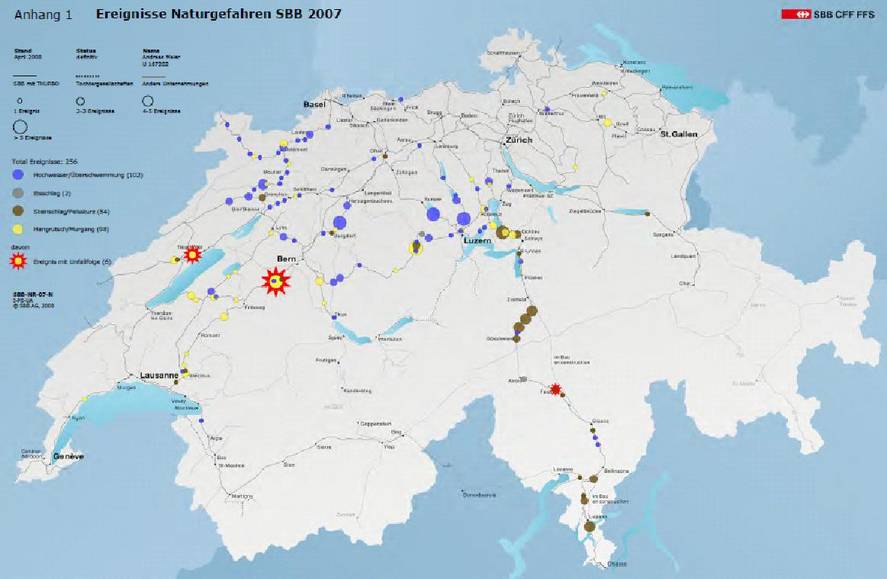
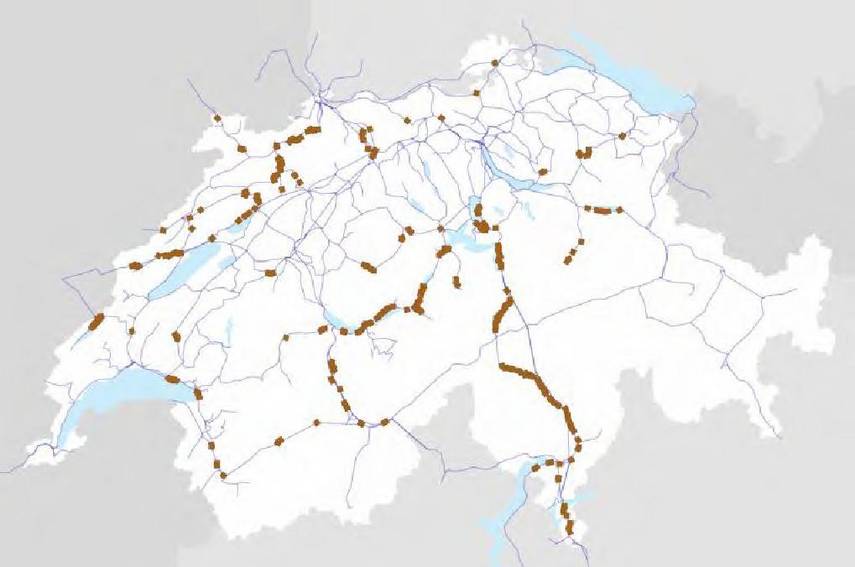
As a result of this screening phase, a very rough, large scale general hazard map can be produced which shows which part of the network have a potentially high exposure to the different natural hazards such as flooding, landslides and mud slides, rock fall, snow avalanches and wind throw and which therefore should be assessed in more detail. For an example see the following figure.
2nd level: Further investigation of priority areas by modelling efforts, development of maps of potential natural hazards:
Once the priority areas have been identified, modern modelling techniques can be used to simulate natural hazards and their potential impacts. For each type of natural hazard a dedicated modelling approach has to be used.
Fluvial flooding: Flood maps with different flood intensities (typically 50 year, 100 year and 250 year flood events) are available for many European countries with a high spatial resolution and mostly in digitalized form. In order to identify the line sections with the highest exposure to fluvial flooding, these high resolution digital flood maps have to be linked with the digitalized railway infrastructure data.
Surface flooding: On the basis of accurate surface relief data (e.g. obtained by laser scanning) and using a mathematical model of rolling balls it can be calculated with an excellent spatial resolution where water potentially accumulates. When the output of this modelling is merged with the digitalized network data, the line sections and infrastructure assets such as tunnels, railway stations, bridges etc. can be identified which have a high risk of exposure to surface flooding.
Rock fall: Specialized rock fall models allow to calculate, if falling rocks or rock avalanches have the potential to reach the railway line and if their energy is high enough for causing damage. Using the outcomes of the models, line sections can be classified according to potential rock fall exposure.
Snow avalanches: Snow avalanche models work similar to those for rock avalanches. The destructive energy of a potential avalanche highly depends on the slope of the terrain.
Landslides and mudslides: The modelling approach uses elevation models as well as models for soil characteristics and composition. Especially important in this respect are the drainage properties of the soil.
Wind throw: Wind and storms are very difficult to model with a good spatial resolution. Therefore, the identification of line sections which have a high exposure to wind throw is mostly done by analysing data from past weather events.
The modelling effort for all above mentioned natural hazards results in maps for potential hazards. Whether real hazards can develop or not depends on the real situation in the identified area as well as on the existence and status of protective structures and/or protective forest. An area potentially exposed to rock fall hazard is e.g. likely to be highly endangered if the rock faces are eroded and rock fall barriers do not exist.
As an example for the 2nd level the potential hazard maps used at SBB are described in more detail:
Maps of potential hazards have been developed by the Swiss Federal Office for the Environment FOEN for all Swiss regions. The following natural hazards have been included:
Rock fall
Landslides
Debris flow/mudflow
Snow avalanches
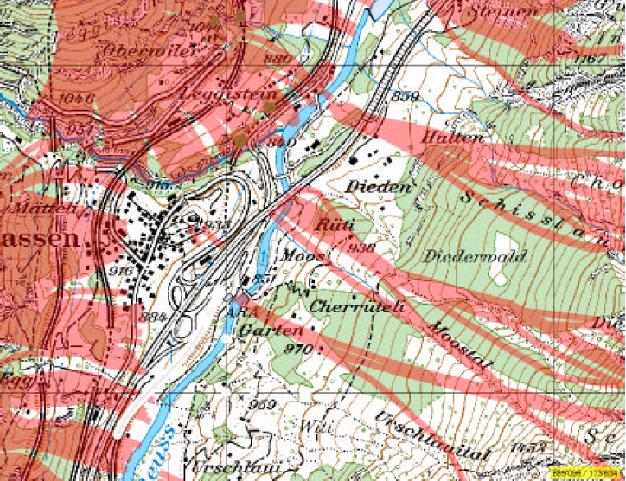
Areas of potential rock fall have been modelled with a high resolution. A potential hazard is indicated on the maps if rock fall processes can impact railway tracks, roads and settlements on cause damage.
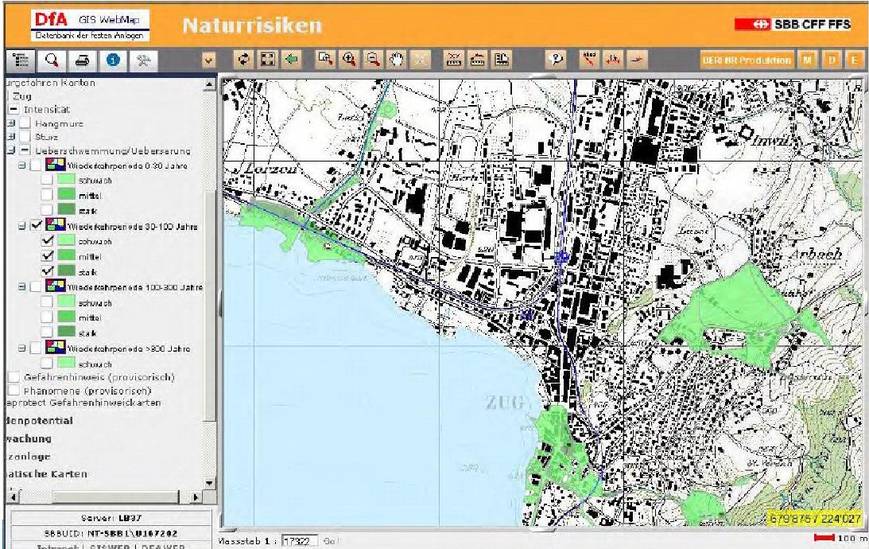
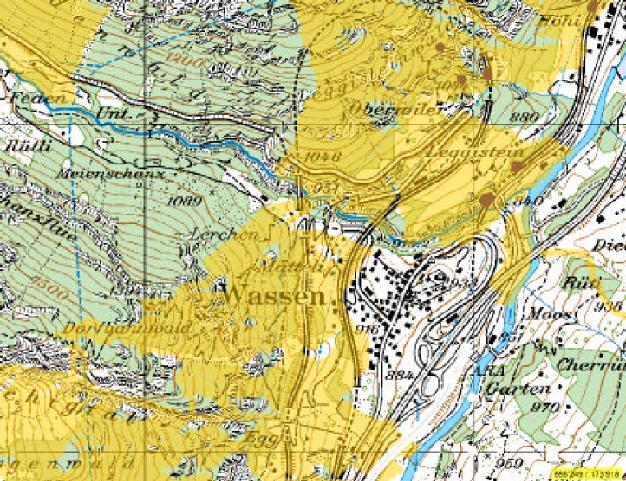
A similar set of maps of potential hazards (Gefahrenhinweiskarten) is available for all regions in Switzerland for landslides, mudslides and snow avalanches. For the modelling, detailed digital relief data and slope data as well as data for the composition of the earth and precipitation data were used. Potential hazards were only indicated if the relevant processes could reach infrastructure assets, settlements etc. The following figure shows areas of potential landslides in yellow:
If these data of potential natural hazards are merged with the digitalized railway network data, maps highlighting those line sections with the potentially highest exposure to the different types of natural hazards can be generated.
3rd level: Integration of on-site knowledge including information about protective measures
The maps of potential hazards from the 2nd level can be further improved by integrating knowledge about the real situation in the relevant areas including information about protective measures and structures. This requires a survey program with dedicated on-site inspections, preferably by teams with expertise in geosciences.
The survey program should focus on those line sections with the highest potential exposure natural hazards in order to keep the effort reasonable. Furthermore, the on-site inspections should be highly standardized and a well structured and easy to use template should be used to record the results.
The inspections should both cover the real status of the areas where hazardous processes could get started and the status of protective structures and measures if existing. For the different types of natural hazards the following aspects should be assessed:
Rock fall: Actual status of the rock faces, type of rock, degree of erosion, status of protective nets
Landslides and Mudslides: Detailed data on soil composition, status of protective forest, status of drainage system ..
Snow avalanches: Detailed data on soil properties, slopes, precipitation data, status of protective structures
Flooding: Detailed data on soil composition, precipitation data, status and capacity of drainage system
When merging this field knowledge with the output from the modelling of potential natural hazards and the digitalized railway network data, real hazard maps for railway use can be generated.