One way to identify vulnerable parts of the railway infrastructure is the detailed analysis of past extreme weather events and their impacts on infrastructure assets. In the following figure, a map with examples of extreme weather events in Europe within the last decade is shown:
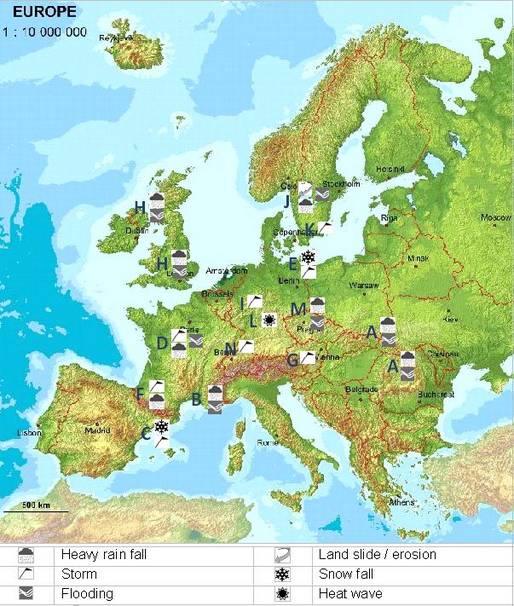
The events covered are listed in the following table:
A | 2010: | Flooding in Romania (Poland; Ukraine) caused seriously damages and destruction of rail lines and bridges |
B | 2010: | Flash floods caused by torrential rain in South Eastern France (Worst downpours in the region since 1827); Train services along the coast were cut off. |
C | 2010: | "Low Andrea caused wind speed up to 150 km/h and heavy snow fall with up to 60-70 cm in North Eastern Spain (Barcelona Region with most heavy snowfall since 25 years; also other Mediterranean Sea Area); No bus transport in Barcelona and almost no railway services. |
D | 2010: | Winter storm "Xynthia with hurricane-force wind speeds up to 238 km/h and torrential rains with flooding in Western and Central France (South Western Germany), caused tree felling and roads and railway lines to be cut off |
E | 2010: | Winter storm "Daisy" with wind speeds of more than 100km/h, with snow fall and snow drifts, freeze in North Eastern Germany (Eastern and Northern Europe); caused road and railways closings |
F | 2009: | Winter storm "Klaus" with wind speed up to 200km/h and torrential rains in South Western France, Northern Spain (Andorra 216 km/h) and Italy caused forest damages and thus 48 hours no rail traffic |
G | 2008: | Winter storm "Emma" with wind speed between 100 till 230 km/h in Austria; coming from Germany with wind speed between 126 till 140 km/h |
H | 2007: | UK floods: After a long rainfall period, more than one hundred flooding or bank-slip incidents on the rail network in the whole UK (wettest summer ever). This caused widespread delays and temporary rail line closures |
I | 2007: | Winter storm Kyrill with wind speed up to 225 km/h caused massive tree felling, particularly in North Rhine-Westphalia, Germany. Coming from Northern England via the North Sea to the Baltic Sea/ Baltic States; also other Eastern European States |
J | 2006: | Intensive rain upstream, caused a high flow and erosion in Western Sweden (South of Munkedal covering the E6 road and the Bohus rail line; Ånn in Jämtland, washed away a road and rail embankment). |
K | 2005: | Winter storm "Gudrun with wind speed up to 150 km/h in South and Western Sweden (Ireland, UK, Norway, Finland, Russia); caused storm felling of forests and a closure of the rail network due to fallen overhead lines, damaged or destroyed pylons). |
L | 2003: | Heat wave ("High Michaela") with maximum temperatures of 35 to more than 40°C (longest heat wave since 1950) in Germany (France, UK etc.) |
M | 2002: | Elbe flooding in Eastern Germany, due to heavy rainfall of up to 312 mm within one day in the catchment area (Czech Republic) |
N | 1999: | Winter storm "Lothar" with wind speeds of more than 200 km/h in France, Switzerland and South Western Germany |
The in-depth analysis of extreme weather events requires a systematic recording and documentation of past events. In order to guarantee easy access and a structured analysis, all relevant information should be stored in a centralized event database. All those events should be covered which either caused delays in train operation, line closure or damage of infrastructure assets.
The recording should be done in a systematic way using a standardised template. This template should contain general information such as time of the event, location (line section) etc., information about the weather event (type of event, duration, intensity..) using predefined criteria and a detailed description about the impact on the infrastructure.
As a second step in the process of event documentation, the entered data and impact descriptions should be assessed by an expert or a by a team of experts. This insures the correct classification of the cause of the incident as well as a well founded impact analysis.
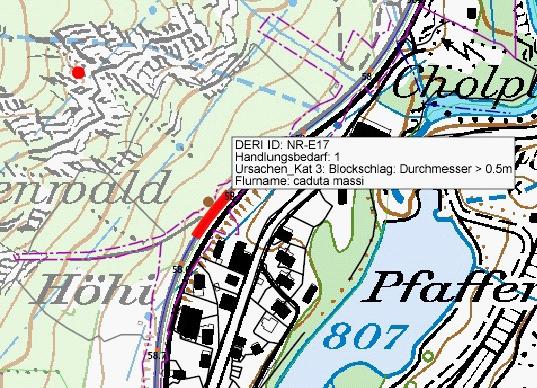
For a better accessibility and usage of the data in further stages of the vulnerability analysis, the assessed data sets should be visualised using a graphical information system (GIS).
Example: Systematic Event Recording at SBB
Data recording using DERI NR
DERI NR is an instrument to record and document natural hazards at SBB. The core part of the system is a central database where all relevant current events are being recorded. Gradually, historic event data are being integrated into the database. The recording process follows a 2-step approach:
Registration of key data of an event & submission to specialist
Full documentation by a specialist and evaluation
Visualisation in WEB GIS
After evaluation of an entry the data from DERI NR taken over into the GIS of SBB.
This system allows
Queries about ice falls and avalanches at the Gotthard line
Comparison with previous recordings in the area
Use of natural hazard maps modelled by SILVAPROTECT (Bafu).
Outlook
The data base will be developed into a system for evaluation of risk sites. For this purpose, an inventory of protective systems showing the status of each protective measure will be integrated. On the basis of risk data, hazard maps and taking into account defined protection targets, appropriate protection measures can be planned in the future.