
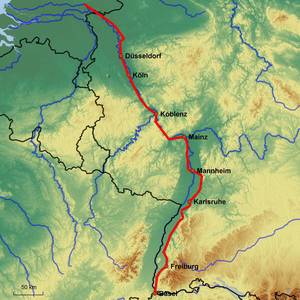
Expected Climate Loads for the Rhine Valley (2050/2080)
1) Temperature changes
The expected changes of the average temperature until the 2050ies for the Rhine Valley are between +1,5 and +2°.
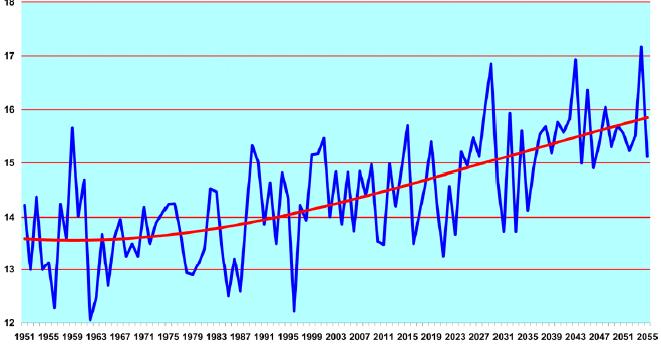
The regional variation of the temperature changes for the same period is shown in the following figure:
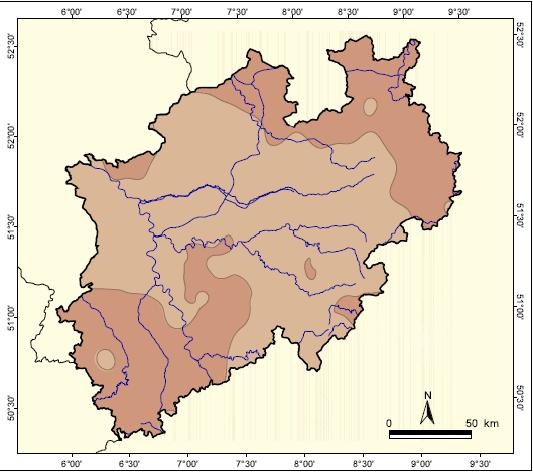
The most significant changes can be seen in the expected number of so called event days, which are indicators for extreme weather events. The following changes are projected:
Subzero days: -12 .-30 days!, average 20 (30%)
Summer days (T>25°) + 9 .+26 days, average: +63% (max: +100%)!
Hot Summer days (T>30°), +2 +12 days, av: +136%, max > 150%
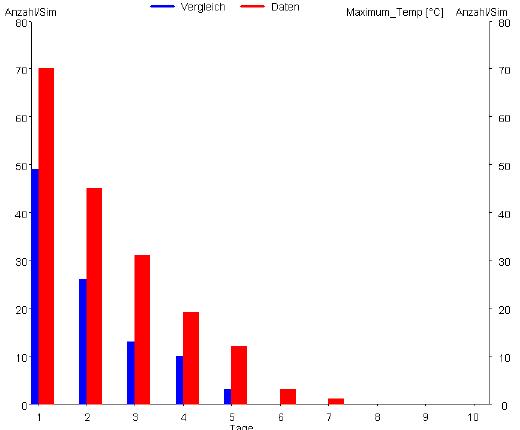
There is a clear trend towards warmer and hotter summers and a significant increase in warm and hot days. A more detailed analysis shows that the likelihood of heat waves increases considerably:
2) Precipitation
The expected changes in precipitation are also significant. Especially in winter, there are considerable increases in the amount of precipitation projected.
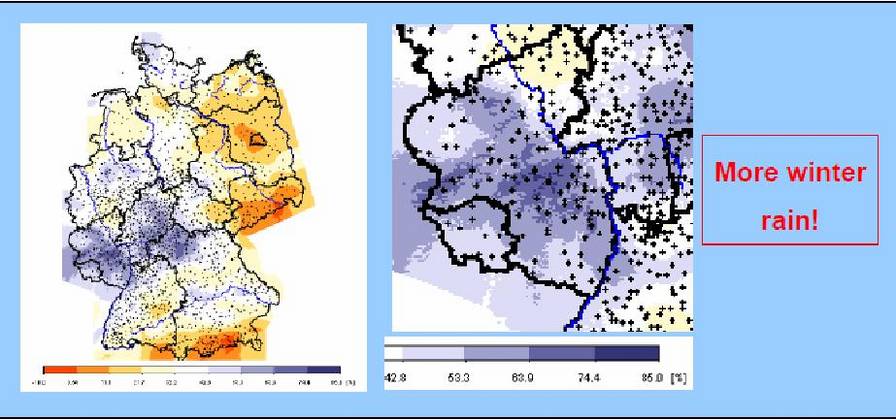
Especially for the Mountain Ranges on the left side of the Rhine, increases of more the 60% are possible. Consequently, the risks of fluvial as well as surface flooding could increase dramatically.
3) Storms and gales
From regional climate modelling there is evidence of a significant change in the frequency and intensity of storms over Germany in future decades. The resulting increase in annual average losses for North Rhine Westphalia (NRW) are +8% for the A1B and +19% for the A2 scenario, respectively. In regional terms, the largest changes in insured losses are found for north and north eastern NRW, where the annual average losses may increase by up to 36%. When considering only storms with return periods above 20 years, loss expectations may increase by a factor of 2.
Past extreme weather events
The following list gives an overview over past extreme weather events which have heavily affected the operation of railway infrastructure and sometimes even the integrity of infrastructure assets.
|
Vulnerability Study for the Rhine Valley
a) Screening Process
Parts of the Rhine Valley Route which are situated in areas with increased likelihood of natural hazards and therefore have potentially higher vulnerabilities will be identified within the framework of a screening process. The screening will be performed on the basis of flood risk maps (see GIS of DB AG) and hazard maps for vegetation (wind/storm throw). A first rough assessment indicated t, hat the line sections between Koblenz and Troisdorf are particularly interesting, since considerable parts of the railway tracks are located directly within flood planes and surrounded by mountain slopes and are therefore potentially prone to the impacts of surface and fluvial flooding as well as land- and mudslides.
b) Analysis of past vulnerabilities
The parts of the route identified by the screening process will be investigated more deeply. An important step is the detailed analysis of the data base for delay minutes, focussing on weather related delays in the concrete route segments. The spatial resolution of the enquiry (exact location of the delay/disturbance) should be as good as possible in order to allow the linkage of hazards to concrete infrastructure assets. Later in the process, these data will be complemented by data from database where damages to the infrastructure are recorded.
c) Analysis of current and future vulnerabilities
On the basis of the results of step 1 and 2, interviews with the people responsible for the route segments will be carried out. The current status of the infrastructure assets will be analysed. It will be discussed in detail, how future climate loads can impact the local railway infrastructure. Especially vulnerable infrastructure assets will be identified.
d) Measures for the improvement of infrastructure robustness will be identified and discussed in detail.